![PNG Transparent background-1.png]](https://support.cibolabs.com.au/hs-fs/hubfs/PNG%20Transparent%20background-1.png?width=215&height=76&name=PNG%20Transparent%20background-1.png)
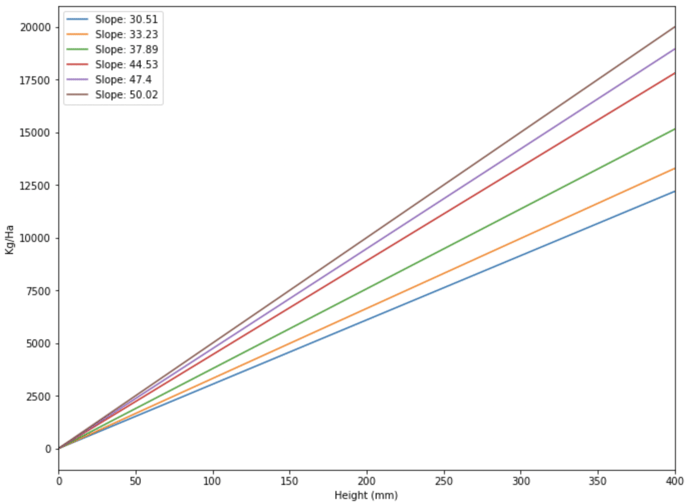
Based on the experimentation performed (see GitHub), several regression lines were found which capture the trends of the different pasture groups. The best performing method involves specifying the dry matter percentage as either “Low”, “Medium” or “High”. The inspiration for using dry matter is as a proxy variable for the current stage in the crop’s growth.
The regression lines are shown below.
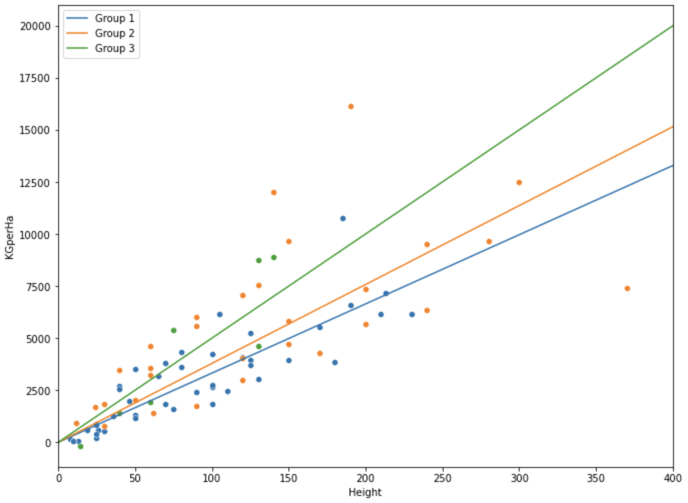
Each combination of pasture group and dry matter category are associated to one of these regression lines. The regression line that a particular pasture group + dry matter category is associated with is the one which most closely models the relationship. The following example displays the points for Rye (Low DM%), Cereal (Medium DM%), and Fescue (High DM%) along with their corresponding best regression line. These are referred to as Group 1, Group 2 and Group 3 respectively.
Each relationship is summarised as a linear equation with intercept 0 and slope Y. Therefore, given the height, the KG/Ha is calculated as Y times height. These relationships are as follows:
|
Group |
Slope |
Pasture Group & Dry Matter |
|
1 |
30.510229 |
Cocksfoot | Medium |
|
Lucerne | High |
||
|
Native | High |
||
|
Fescue | Low |
||
|
Lucerne | Low |
||
|
Phalaris | Medium |
||
|
Lucerne | Medium |
||
|
Cereal | Low |
||
|
Canola | Low |
||
|
2 |
33.232179 |
Rye Mix | High |
|
Lucerne Mix | High |
||
|
Mixed | Medium |
||
|
Rye | Low |
||
|
3 |
37.892347 |
Phalaris Mix | Low |
|
Cereal | High |
||
|
Native | Low |
||
|
Lucerne Mix | Low |
||
|
Cereal | Medium |
||
|
Broadleaf Mix | Medium |
||
|
4 |
44.526338 |
Phalaris Mix | High |
|
Lucerne Mix | Medium |
||
|
Clover | Low |
||
|
Canola | Medium |
||
|
Canola | High |
||
|
Rye | Medium |
||
|
5 |
47.396075 |
Rye Mix | Low |
|
Vetch | Medium |
||
|
6 |
50.016746 |
Kikuyu | Medium |
|
Fescue | Medium |
||
|
Fescue | High |
||
|
Phalaris Mix | Medium |
||
|
Clover | High |
||
|
Rye | High |
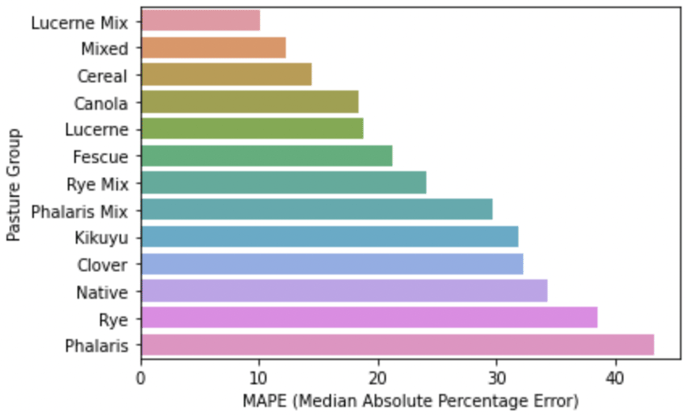
Greatness of fit was measured using MAPE (median absolute percentage error) which represents the typical error percentage of a predicted KG/Ha. For example, if a predicted value is 108 but the actual value is 100, then the APE is 8%. The APE is also 8% if the predicted value is 92. MAPE is calculated as the median APE. The following visualisation shows the MAPE for each pasture group.
The Dry Matter categories were defined by creating 3 equally size bins (Low, Medium, High) for each pasture group. In some cases, due to the lack of variance in the data, less than 3 bins could be created for a given pasture group. Therefore, for some pasture groups, there are 2 (Low, High) or even 1 group (Medium). The results of the equal size binning are shown in the following table.
|
Pasture Group |
Dry Matter Range |
Dry Matter Category |
|---|---|---|
|
Broadleaf Mix |
(-inf, inf] |
Medium |
|
Canola |
(-inf, 0.245] |
Low |
|
Canola |
(0.269, inf] |
High |
|
Cereal |
(-inf, 0.3] |
Low |
|
Cereal |
(0.3, 0.4] |
Medium |
|
Cereal |
(0.4, inf] |
High |
|
Clover |
(-inf, 0.3] |
Low |
|
Clover |
(0.3, inf] |
High |
|
Cocksfoot |
(-inf, inf] |
Medium |
|
Fescue |
(-inf, 0.324] |
Low |
|
Fescue |
(0.324, 0.503] |
Medium |
|
Fescue |
(0.503, inf] |
High |
|
Kikuyu |
(-inf, inf] |
Medium |
|
Lucerne |
(-inf, 0.3] |
Low |
|
Lucerne |
(0.3, 0.305] |
Medium |
|
Lucerne |
(0.305, inf] |
High |
|
Lucerne Mix |
(-inf, 0.28] |
Low |
|
Lucerne Mix |
(0.28, 0.341] |
Medium |
|
Lucerne Mix |
(0.341, inf] |
High |
|
Mixed |
(-inf, inf] |
Medium |
|
Native |
(-inf, 0.8] |
Low |
|
Native |
(0.8, inf] |
High |
|
Phalaris |
(-inf, inf] |
Medium |
|
Phalaris Mix |
(-inf, 0.285] |
Low |
|
Phalaris Mix |
(0.285, 0.331] |
Medium |
|
Phalaris Mix |
(0.331, inf] |
High |
|
Rye |
(-inf, 0.3] |
Low |
|
Rye |
(0.3, 0.308] |
Medium |
|
Rye |
(0.308, inf] |
High |
|
Rye Mix |
(-inf, 0.55] |
Low |
|
Rye Mix |
(0.55, inf] |
High |
|
Vetch |
(-inf, inf] |
Medium |