![PNG Transparent background-1.png]](https://support.cibolabs.com.au/hs-fs/hubfs/PNG%20Transparent%20background-1.png?width=215&height=76&name=PNG%20Transparent%20background-1.png)
Summary
Cibo Labs aims to provide producers with a range of data focused services that facilitate informed decision making and better grazing management in various livestock enterprises. The PastureKey service can be accessed via the Cibo Labs dashboard using myMLA credentials to log in, more information on the basics are included here;
However, there are four components of PastureKey which can be used in isolation, best practice would involve application of all four management practices, components include:
4. Feed Budget Calculator Tool
The Dashboard
Upon accessing the Cibo Labs dashboard the 'My Farms' section provides you with your farm details and ability to view and manage all features.
The list and grid views give you access to a range of details including farm name, farm ID(PIC) and Size closely associated with features such as Maps, Reports and Assessments, and management functions, Manage to edit parcels and paddocks and Share.
List View:

Grid View:

| Function Key |
Function Description |
 |
Farm Maps - Farm maps include both AFM and/or PastureKey services. Users can access farm maps, imagery layers, charts, data files and the forage budget calculator for PastureKey subscription holders. |

|
Reports - Farm Reports are accessible, providing the ability to access all downloaded data files, requested from the map layer and acts as an archive. Additional farm and paddock-level reports can be ordered in this section, more information regarding these reports can be found HERE. |
 |
Forage Budget Calculator Tools - Only accessible by PastureKey subscribers, the farm and paddock level calculators are auto-populated with pasture data to proactively assist users in managing feed demand and supply decisions using Animal Equivalent (AE) or Dry Sheep Equivalent (DSE) systems. |
|
|
Get PastureKey - Indicates that the farm is available to activate a PastureKey subscription. Users can set up their PastureKey service including mapping their paddocks, request processing of the paddocks and access maps while in the 30-day FREE trial of PastureKey. |
|
|
In PastureKey Trial - Indicates this property has started a 30-day FREE trial of PastureKey. |
|
|
Manage - allows users to update or edit your farm or paddocks(PastureKey only). This includes changing, deleting farm parcels that are no longer a part of your property or to create an additional farm on the associated PIC. |
|
|
Share - function is aimed at producers who may consult with third party members (i.e. consultants or advisors). You can share your AFM data with a third party member, provided they have a Third Party Subscription on the Cibo labs platform. |


To share your PastureKey service with other members in your organisation requires account sharing access. This can be completed from the PastureKey subscription owners account.
Demo Farms
You can also view our Demo Farms by clicking 'Show Demo Farms' in the top right corner of your dashboard. 
You will see a Demo Farm and associated details appear in a window above your current dashboard. This Demo Farm allows users to take a look at both an AFM and PastureKey service. PastureKey is our subscription-level service and this Demo Farm will provide insight into what's on offer if you choose to upgrade.

Maps are accessible via ![]() including the option of viewing:
including the option of viewing:
1. Base Map layers
2. AFM Map layers
3. PastureKey Layers (PastureKey Subscribers).
A useful resource to compare map services please refer to: What's the difference between the Australian Feedbase Monitor (AFM) and PastureKey?
1) Maps
Features and Functions:
Map layer view, enables the user to elect their preferred 'Base map' view, and then to select and review PastureKey service layers.
Left Pane Menu:
| Features and Functions | Description |
|
Farm Name |
Background map imagery the user can choose to view there property layers behind. |
|
Get Reports |
Allows the user to access farm reports and the data section of the dashboard. |
| Zoom: + or - | Utilise the plus and minus before panning around the map by clicking and dragging with your mouse |
| Center view | Allows you to geolocate your current location |
| Cog | allows you to access the "manage farm" options such as editing farm or paddocks. |
| Help | Help Tools for the Map and services |
Time slider:
| Features and Functions | Description |
|
Time slider bar |
The ability to move backwards and forwards through the date ranges. |
|
Date |
Identifies the date that the data capture was taken |
| Data download | Access all recent PastureKey data files from data captures including CSV files and imagery. |
| Forage Budget Calculator | Access farm and paddock level forage budget calculator for both AE and DSE production systems. |
View service layers including Base, AFM and PastureKey layers using the 'show layer' icon in the top right of the screen. An overview of each layer has been outlined below.
A) Base Map Layers
Map layer view, enables the user to elect their preferred 'Base map' view, and then to select and review PastureKey service layers.
| Base Map layer types | Description |
|
Esri World Mapbox satellite Open Street Map Mapbox Street layers |
Background map imagery the user can choose to view there property layers behind. |

B) PastureKey Map
- The PastureKey Map is accessed through the Cibo Labs dashboard and quickly displays the most recent satellite imagery in a single date or in a composite (30 days) with multiple layer view options.
- To access the PastureKey layers ensure PastureKey is selected, to view from a range of pasture biomass and cover layers.
Map layer types Description PastureKey - Single Layers Choosing the single date using the toggle will display layers associated with satellite images sourced from that particular satellite capture of your property. PastureKey - Composite Layers Choosing the composite layers icon allows you to view data from merged imagery for the last 30 days. Using the toggle, you can view layers and access data that have been averaged or "mosaiced/merged" over the last 30 days of imagery for the chosen date selected. 
The PastureKey Map is updated every 5 days, and shows a choice of Single or Composite viewing options.
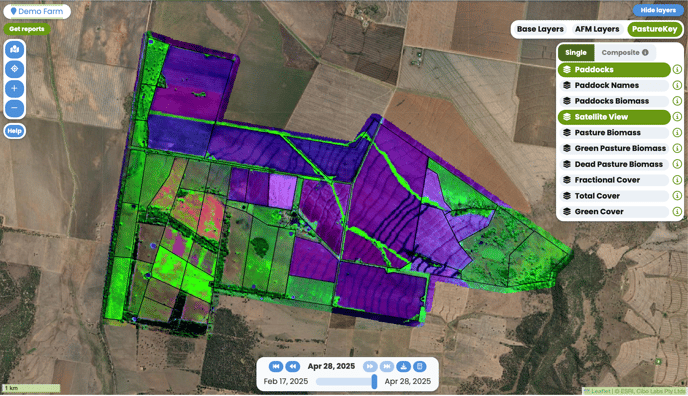
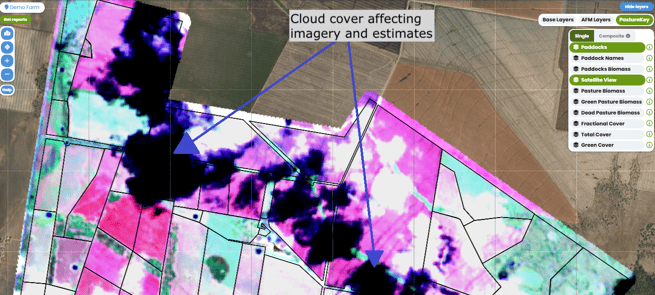
When you check the PastureKey Layer, firstly review the 'Satellite View' layer to see if paddock data is available. Where there has been significant cloud cover, holes or patches in the data will be evident. Use the scale legend on the "Satellite View" imagery to assess the level of interference to your data. Where there has been significant disruption from cloud, shadowing or other satellite noise (that is out of the control of Cibo Labs) it is best to refer to the Composite data and subsequently the CSV Data file which can be downloaded from the export icon on your map at the bottom of the page near the time/date slider.
 Example 1: PastureKey Single Layers screen, with paddocks pasture biomass and paddock names selected.

Example 2: Shows the PastureKey - Composite Layer- 30 day rolling merge of imagery for the pasture biomass layer, including areas that have been cloud affected.
Paddock information:
In PastureKey, select the layers you wish to view. To access your paddock details, click on the paddock you are interested in. A pop up window will appear that displays the:

- Paddock Name
- Estimate Date: of data capture by the satellite
- Biomass (TSDM): Total Standing Dry Matter data reported in kg/ha of that selected paddock
- Est. Cloud Free: The estimate percentage (%) of the paddock at the satellite capture date, that has been captured in the analysis by the sentinel-2 satellite and that is not affected by interference such as cloud, cloud masking, shadowing effects within the atmosphere and your landscape.
- Area: In hectares the area of the selected paddock.
- Food on Offer (Tonnes): The total amount of estimated biomass available in the paddock reported in tonnes of Dry matter (DM)
- Trend: This indicator provides a status of "decreasing, increasing or steady" to describe the trend that is occurring in the paddock for biomass.
PastureKey - Single Layers
Definitions of each map layer, legend symbology and measure metric unit is displayed below:
| Map Layers |
Legend and Symbology |
Description/Definition: |
| Paddocks |
|
The property paddocks boundary outline. The paddocks are symbolized with a black line outline. |
| Paddock Names |
|
This layer is to view paddock name labels. These are displayed on the paddocks layer map. To turn paddock names on, click on paddock names layer to turn it on. You may be required to zoom 'in' to full extent 200m or refresh your screen to initiate this layer. |
| Pasture Biomass |
|
Total Standing Dry Matter (TSDM) - The total amount of pasture, measured in kg/ha, after the water content is removed. It includes both green (actively growing plant material) and dead (senesced standing material) but excludes plant litter. |
| Satellite View |  |
Enhanced Natural Colour Satellite Image - Sentinel-2 10m resolution, multispectral imagery using bands 11 (SWIR), 8 (NIR) and 4 (Red) displayed as red, green and blue respectively. Bright green represents vigorous, healthy vegetation including forests, crops and growing pasture. Dry forests and woodland appear in a muted green through to browns. Sparsely vegetated, dry pasture and bare areas appear brown and mauve showing variability in soil colour. The area affected by cloud cover, shadow or other forms of interference can is represented using the legend. If you see images or part images with these images, this spatial interference at the time of capture will result in no data capture over your property, until the next cloud free or shadow effect fly over of satellite is captured. |
| Total Cover |
|
Derived from Fractional Cover. The combined percentage of ground covered by green, dead or dry vegetation. Vegetation includes grasses, forbs, shrubs and trees. Total cover % = green cover % + dead or dry cover %. Also, Total Cover % = 100% - Bare Ground %. |
| Green Pasture Biomass |
|
Green Standing Dry Matter (GSDM) – The total amount of photosynthetically active growing plant material in kg/ha. This is the 2nd component that makes up TSDM (Kg/Ha). The map legend symbology and displayed unit of measure on this layer is represented by: |
| Green Cover |
|
The percentage of ground covered by only the photosynthetically active vegetation and only representing one portion of Fractional Cover (green). Vegetation types includes grasses, forbs, shrubs and trees. The map legend symbology and displayed unit of measure on this layer is represented by:
|
| Fractional Cover |
|
The percentage of ground covered by three key components: photosynthetically active vegetation (green), non-photosynthetically active vegetation (dead or dry), and bare ground. The three proportions add to 100%. Vegetation includes grasses, forbs, shrubs and trees. |
| Dead Pasture Biomass |
|
Dead Standing Dry Matter (DSDM) – The amount of non-photosynthetically active plant material, such as dead leaves and stems in kg/ha. This is one component that makes up TSDM (Kg/Ha). |
| Paddock Biomass |
|
Paddock Biomass - averaged across paddocks Averaged Total Standing Dry Matter (TSDM) - The total amount of pasture averaged across each paddock, measured in kg/ha, after the water content is removed (dry equivalent). It includes both green (actively growing plant material) and dead (senesced standing material) but excludes plant litter. |


PastureKey - Composite Layers
The legend symbology of each composite map layer are the same as the single layer (by name) options, except for the special composite layer below:
|
Map Layers |
Legend and Symbology | Description |
| Pasture Biomass change |
|
Pasture Biomass Change compared to 30 days ago Rolling 30 day Pasture Biomass Change - This layer shows the variable change in Total Standing Dry Matter (TSDM) relative to the previous estimates for the date epoch/represented 30 days ago. The rate of change descriptors for the shading symbology indicated on the map and measured by the legend can be described as follows: Large loss represents <50% of last month; |

TSDM estimates use regional calibrations that may not fully represent your pasture types or seasonal conditions. If you are undertaking an initial trial of the service without local calibrations, please interpret the TSDM products as a RELATIVE PASTURE INDEX. Initial evaluations should focus on the 'relative' biomass levels across and between paddocks, i.e 'this paddock is 25% higher than the next paddock', or 'the ridges in the paddock are 50% lower than the gullies'.
Land types, pasture composition, seasonal conditions and growth stage play a major role in estimating Palatable Yield relative to Total Standing Dry Matter (TSDM). For example, Spinifex may have high TSDM but low palatability.
Work is well advanced on the estimation of palatable yield, and these estimates will be available soon.
2) Your Data & Reports:
- To access your data based on the map you are viewing, choose the single or composite layers in the PastureKey map you require.
- Select the date of interest in the time-slider at the bottom of the map. Choosing a date that is closest to the most accurate satellite capture** dates for your property will ensure data is accurate when downloading
- **Select "Satellite view" on the layers to determine if your imagery is affected by cloud cover.
- Once data is selected, "Download" the data via the time slider, you are now provided the opportunity to access your data live. Users can select between three different format types to access the data at any time. Imagery files, or data download options which contain either CSV Data or a GeoJson Download.
Data Download selections:
Users can now select imagery layer files, multiple imagery files can be selected at the same time.
Once a selection has been made complete the process via "Download Data package".
The data package will be sent via a zip file directly to your email. The email will provide you with the zip folder, which will contain your selected imagery files for your farm.

More support information can be found by clicking the "More Info" link in the download window.
Please note: For large farms that contain >300 paddocks, it may take approximately 30 minutes to generate the data file. Smaller farms, should receive the zip file and email notification within 10 minutes of requesting the download. Please reach out to the Customer Engagement Team if you have not received the requested download within these timeframes.
Data - CSV:
This data download option directly allows users to quickly and easily receive there paddock pasture biomass data in (kg DM/ha) to allow them to create fodder budgets easily and integrate this data into other systems feed budgets templates or if you need to do calculations of stocking rates or graph your paddocks pasture growth rates this data can easily be used in any spreadsheet package as shown in Figure 1. It also through the csv file, can be easily shared with other staff members or business partners.

Figure 1: Example of a graph showing Estimates of Total Standing Dry Matter (TDSM) (Kg/Ha) for monthly monitoring for your property using this Data-CSV download in pasture Key.
Downloads of your TDSM data and performance of your paddock can now easily be requested as and when you need it. We have removed the one-drive folder and the one file csv data excel spreadsheet with your TDSM values to create this streamlined, live, quick simple and easy option. Users can look at the imagery and easily request the TDSM data file that suits your timeframe requirements based on the satellite imagery that is available from your property
For the date selected on the pastureKey map time slider in either the single date or composite layers, when you select this data csv download. The csv is sent to your downloads folder.
The CSV (Comma Separated Variables) file requested will contain the following naming convention:
-
- PaddocksTdsmTimeSeries_PropertyName.csv
The csv file has the following KEY columns contained within each data request:
| CSV File Column Heading Reported In File Download | Definition |
| property_name | The name of the property files data being displayed |
| paddock_name | The name of the paddock the data corresponds too, if provided. |
| paddock_area (Ha) | Paddock Area in hectares |
| date | The date of each satellite overpass selected on the map and requested for data download |
| Percentage_Captured (%) | The estimate percentage of the paddock at the satellite capture date, that has been captured in the analysis by the sentinel-2 satellite and that is not affected by interference such as cloud, cloud masking, shadowing effects within the atmosphere and your landscape. |
| modelled_biomass (Kg/ha) |
This is the average biomass estimate for each paddock ( TSDM) of pasture for the 15 day average that is made up of three 5-day satellite captures . If however, the property location is positions where one or consecutive satellite captures are affected by interference e.g. cloud, the estimate provided is calculated by modelling, a weighted "line of best fit" to interpret the current estimate TSDM value using up to 45 days data of 5 data set points. Please note: If the previous month's data is cloudy, the value provided reverts to the imagery_observation data value captured at that satellite overpass. |
| modelled_biomass error (Kg/Ha) | estimated_error (Kg/Ha)
The estimate_error data provides (+ or -) the range of how much we reasonably expect our Total Standing Dry Matter (TSDM) (Kg/Ha) to vary by, considering the quality of the observation for the selected date available in the previous 45 days of observation. For example: if the TSDM is 1200 Kg/Ha and it has a estimated error of 200 Kg/Ha, this indicates that there is estimated to be 1200 kg/Ha across your selected paddock, however there may be up to 200 kg/ha more dry matter available at that capture or 200 kg/ha less biomass from the estimated TSDM figure. This provides a guide only to the upper and lower limits of TSDM for each observation being analyzed. Estimated_error data will show the impact of cloud, topography of your landscape with shading of valley's, hills etc at the satellite overpass captures for your property. This new metric, has been included to help users understand the estimate possibility range of estimated available TDSM (Kg/ha) for each paddock on there property and to provide confidence in the accuracy of the estimated TDSM data being provided. If users feel that the data presented, does not consistently represent there property estimated TSDM +/- and the estimated error data. Please contact Cibo Support team for further investigations and ground truthing of this live model. |
| modelled_biomass_change (kg/Ha/day) |
The difference between two modelled observations, 5 days apart. This value can either be positive (indicating growth) or negative (indicating loss of production quantity). |
| modelled_biomass_trend |
A indicative descriptor of the movement of data between the previous satellite capture and the current satellite capture. The descriptor allocated an "increasing", "steady" or "decreasing" tag to the paddock data, enabling the user to interpret the movement trend of pasture growth within their paddock |
| imagery_biomass (Kg/Ha) | This data is the single date estimate of biomass for the date of each satellite overpass for each paddock. This will be affected by model and atmospheric noise. |
| imagery_biomass_foo (tonnes) | The amount of total pasture biomass feed on offer within the selected paddock. This value is generated by using the imagery_biomass multiplied by the paddock areas (ha), to establish the total feed on offer (FOO). Expressed in tonnes. |
Note: Data- CSV files only report on Total Standing Dry Matter (TDSM) - Kg/Ha figures for the selected date. The file does not report on other selected map layers such as green, dead, total cover layer figures at this time. If this is something that interests you please let; support@cibolabs.com.au know, as we are always looking to improve our products to meet customer requirements.
At each Satellite pass every 5 days, further dates and data will be loaded directly to your maps and be accessible for 'download' and viewing in real time once that data is processed. Allow for up to 4 days for this imagery and data to be available.
The data - csv file download option, allows the user to save these files to your computer. These reports can be generated as many times as required by the user. All generated files and reports are also available in "reports" section of the dashboard as shown in example 3 , and can be accessed at any time by the user through the reports icon on the dashboard or through the left hand side MyFarm management panel as shown below in example 4.

Example 3: An example of the reports window and archive which users can use to access any requested downloads of imagery and data files.

Example 4: Accessing your archive of data and imagery downloads can be found in the 'reports' section through the left land 'My Farm', farm management options.
Data- Geojson
Selecting this Data "Download" Option allows the user to be able to access at any time, quickly and simply a copy of your digital property map.
Instructions:
- Select that time or date on your map using the time slider or the <or> icons on the time slider for the date you wish to view or have downloaded as the property map.
- Select the "Downloads Icon" next to the time slider date range buttons.
- Select - Data - Geojson and Download Geojson.
Upon this download live request, depending on your number of paddocks and size of the property this file download will be occur and be sent to your download page on your computer.
The Geojson File name will be sent to your download folder with the following name
-
- PastureKey - <PropertyName>.geojson
- This file is a digital version of your property mapping and can be loaded into QGIS.
- A great free GIS package can be downloaded from QGIS
This file can be opened with any mapping software package such as QGIS mapping programs the user would like to use or could possibly be integrated with other mapping services and software that the business is using, to enable users to access there property maps as shown below in example 5 at any time.

Example 5: A example of the Data - Geojson Download property map that has been downloaded through QGIS.
Within the download, all attribute details of the property such as paddock lists, Paddock names, areas, and paddock data are also available in this download and can be found in the attributes table.
If you require a previously requested download file, you can go to the "Get Reports" section of your users Cibolabs dashboard, and your historical download requested files data will also be available and listed for users at any time to revisit or re-access.
OneDrive folder transition- The onedrive folders that had previously been used to hold all clients property data will now transition to the new data requests options now available through the updated dashboard. Data can be accessed by the user and retrieved using the 'on-demand' requests for your property using the download button options for the specific single or composite layer satellite overpass dates you are interested in.
If you have data in the old onedrive folder - you would like to keep for your records, please take a copy of your one-drive folder and move this data to your personalized preferred storage system.
More information will be provided to all users regarding this staged transition and shutdown of the Cibo Labs onedrive PastureKey services property folders for existing user clients who had services running before April 2025.
3) Third Party Integrations
AgriWebb
- 5-daily Total Standing Dry Matter (TSDM) estimates of your pasture biomass (kg DM/ha) for every paddock, visible within your AgriWebb dashboard.
- See HERE for more information regarding this integration.
PairTree
- PastureKey can be integrated with a Pairtree service as an integrated service within the Pair Tree central database and dashboard for numerous services.
Whilst we explore additional collaborations with Agtech vendors in Australia if you would like to see PastureKey integrated, please get in touch with our Support Team (support@cibolabs.com.au), we will endeavour to work with the provider to deliver this service.
4) Forage Budget Calculator Tool
This tool is accessed and available to all PastureKey users, through the PastureKey Map.
It is a live, impactful calculator that is quick, simple decision support tool to help producers manage there stocking rate, calculate the number of available grazing days and it can be used as a planning tool that utilizes your properties live data to help you proactively make decision's for implementation in your business.
Instructions to Access the Calculator:
- In the pasture Key map, choose your selected date of interest on the time slider bar.
Once date set - select the Feed Budget Calculator Tool 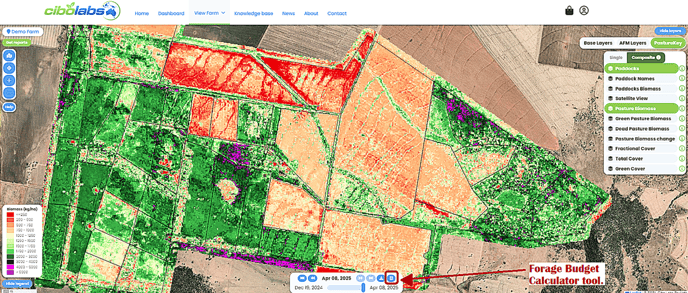
Once you select the calculator, you see a pop up window appear (as below).

Please choose (By clicking on the question to highlight your selection in green) if you would like to calculate either:
- How many stock can I carry within a period? or
- How many grazing days available for my stock?

An example of the Forage Budget Calculator- How many Grazing days, DSE calculator for paddocks.

An example of the Paddocks Forage Budget Calculator, carrying capacity/ stocking rate, AE calculator at paddock scale.
For further specific instructions on how to use the feed calculators for your operation please visit the Forage Budget Calculator Tool User Guide and Quick Start Guide:
If you have any questions or would like to be talked through the services we offer, please reach out to our Customer Engagement Team. We are here to help!
Call us today on (07) 4801 2015 or send us an email at support@cibolabs.com.au